Fisher
Just another WordPress.com site
Normal Distribution
Posted by on April 8, 2011
Why the “Normal Distribution” is Important
The “normal distribution” is important because in most cases, it well approximates the function that was introduced in the previous paragraph. The distribution of many test statistics is normal or follows some form that can be derived from the normal distribution. In this sense, philosophically speaking, the normal distribution represents one of the empirically verified elementary “truths about the general nature of reality,” and its status can be compared to the one of fundamental laws of natural sciences. The exact shape of the normal distribution (the characteristic “bell curve”) is defined by a function that has only two parameters: mean and standard deviation.
A characteristic property of the normal distribution is that 68% of all of its observations fall within a range of ±1 standard deviation from the mean, and a range of ±2 standard deviations includes 95% of the scores. In other words, in a normal distribution, observations that have a standardized value of less than -2 or more than +2 have a relative frequency of 5% or less. (Standardized value means that a value is expressed in terms of its difference from the mean, divided by the standard deviation.) If you have access to STATISTICA, you can explore the exact values of probability associated with different values in the normal distribution using the interactive Probability Calculator tool; for example, if you enter the Z value (i.e., standardized value) of 4, the associated probability computed by STATISTICA will be less than .0001, because in the normal distribution almost all observations (i.e., more than 99.99%) fall within the range of ±4 standard deviations. The animation below shows the tail area associated with other Z values.
Illustration of How the Normal Distribution is Used in Statistical Reasoning (Induction)
Recall the example discussed above, where pairs of samples of males and females were drawn from a population in which the average value of WCC in males and females was exactly the same. Although the most likely outcome of such experiments (one pair of samples per experiment) was that the difference between the average WCC in males and females in each pair is close to zero, from time to time, a pair of samples will be drawn where the difference between males and females is quite different from 0. How often does it happen? If the sample size is large enough, the results of such replications are “normally distributed” (this important principle is explained and illustrated in the next paragraph) and, thus, knowing the shape of the normal curve, we can precisely calculate the probability of obtaining “by chance” outcomes representing various levels of deviation from the hypothetical population mean of 0. If such a calculated probability is so low that it meets the previously accepted criterion of statistical significance, then we have only one choice: conclude that our result gives a better approximation of what is going on in the population than the “null hypothesis” (remember that the null hypothesis was considered only for “technical reasons” as a benchmark against which our empirical result was evaluated). Note that this entire reasoning is based on the assumption that the shape of the distribution of those “replications” (technically, the “sampling distribution”) is normal. This assumption is discussed in the next paragraph.
Are All Test Statistics Normally Distributed?
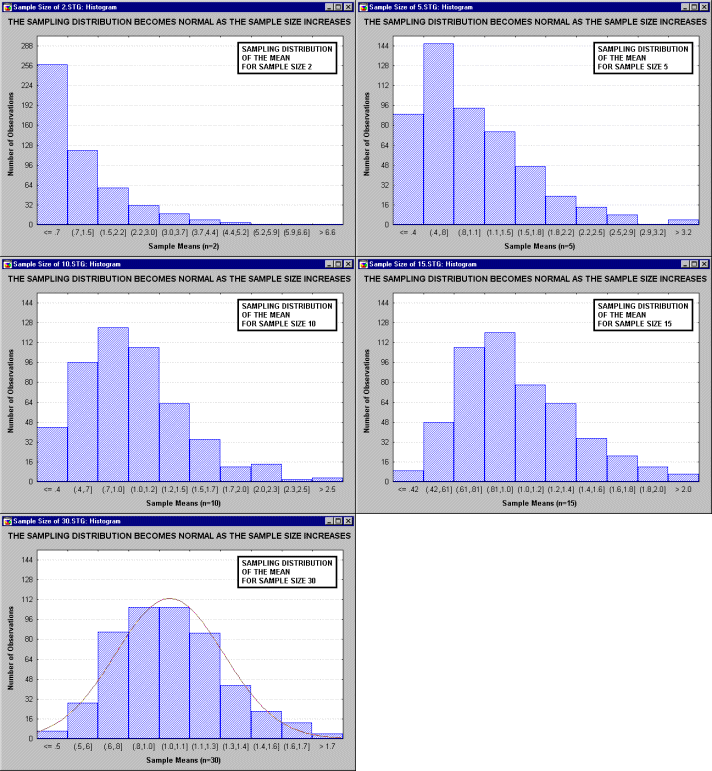
Not all, but most of them are either based on the normal distribution directly or on distributions that are related to and can be derived from normal, such as t, F, or Chi-square. Typically, these tests require that the variables analyzed are themselves normally distributed in the population, that is, they meet the so-called “normality assumption.” Many observed variables actually are normally distributed, which is another reason why the normal distribution represents a “general feature” of empirical reality. The problem may occur when we try to use a normal distribution-based test to analyze data from variables that are themselves not normally distributed (see tests of normality in Nonparametrics or ANOVA/MANOVA). In such cases, we have two general choices. First, we can use some alternative “nonparametric” test (or so-called “distribution-free test” see, Nonparametrics); but this is often inconvenient because such tests are typically less powerful and less flexible in terms of types of conclusions that they can provide. Alternatively, in many cases we can still use the normal distribution-based test if we only make sure that the size of our samples is large enough. The latter option is based on an extremely important principle that is largely responsible for the popularity of tests that are based on the normal function. Namely, as the sample size increases, the shape of the sampling distribution (i.e., distribution of a statistic from the sample; this term was first used by Fisher, 1928a) approaches normal shape, even if the distribution of the variable in question is not normal. This principle is illustrated in the following animation showing a series of sampling distributions (created with gradually increasing sample sizes of: 2, 5, 10, 15, and 30) using a variable that is clearly non-normal in the population, that is, the distribution of its values is clearly skewed.
How Do We Know the Consequences of Violating the Normality Assumption?
Although many of the statements made in the preceding paragraphs can be proven mathematically, some of them do not have theoretical proof and can be demonstrated only empirically, via so-called Monte-Carlo experiments. In these experiments, large numbers of samples are generated by a computer following predesigned specifications, and the results from such samples are analyzed using a variety of tests. This way we can empirically evaluate the type and magnitude of errors or biases to which we are exposed when certain theoretical assumptions of the tests we are using are not met by our data. Specifically, Monte-Carlo studies were used extensively with normal distribution-based tests to determine how sensitive they are to violations of the assumption of normal distribution of the analyzed variables in the population. The general conclusion from these studies is that the consequences of such violations are less severe than previously thought. Although these conclusions should not entirely discourage anyone from being concerned about the normality assumption, they have increased the overall popularity of the distribution-dependent statistical tests in all areas of research.
Excerpt From: http://www.statsoft.com/textbook/elementary-concepts-in-statistics/?button=1
Standard Deviation
Posted by on April 8, 2011
标准偏差 (Std Dev,Standard Deviation), 一种量度数据分布的分散程度之标准,用以衡量数据值偏离算术平均值的程度。标准偏差越小,这些值偏离平均值就越少,反之亦然。标准偏差的大小可通过标准偏差与平均值的倍率关系来衡量。
The standard deviation is a measure of how spread out your data are. Computation of the standard deviation is a bit tedious. The steps are:
- Compute the mean for the data set.
- Compute the deviation by subtracting the mean from each value.
- Square each individual deviation.
- Add up the squared deviations.
- Divide by one less than the sample size.
- Take the square root.
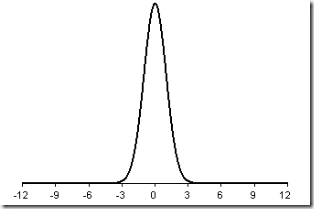
Suppose your data follows the classic bell shaped curve pattern(normal distribution). One conceptual way to think about the standard deviation is that it is a measures of how spread out the bell is. Shown below is a bell shaped curve with a standard deviation of 1. Notice how tightly concentrated the distribution is.
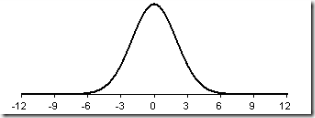
Shown below is a different bell shaped curve, one with a standard deviation of 2. Notice that the curve is wider, which implies that the data are less concentrated and more spread out.
Finally, a bell shaped curve with a standard deviation of 3 appears below. This curve shows the most spread.
For reasonably symmetric and bell shaped data sets:
A common rule in this case is: “Data with a standard deviation greater than half of its mean should be treated as suspect. If the data is accurate, the phenomenon the data represents is not displaying a normal distribution pattern.”
Appendix
Normal Distributions(正态分布)
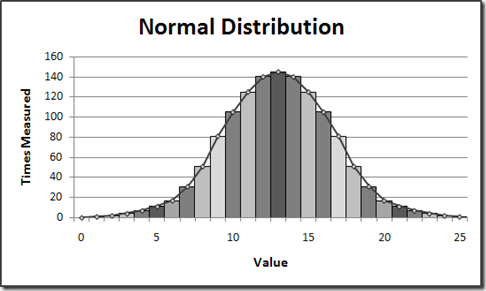
Also known as bell curves, normal distributions are data sets whose member data are weighted toward the center (or median value). When graphed, the shape of the “bell” of normally distributed data can vary from tall and narrow to short and squat, depending on the standard deviation of the data set. The smaller the standard deviation, the taller and more narrow the “bell.” Statistically speaking, most measurements of human variance result in data sets that are normally distributed. As it turns out, end-user response times for Web applications are also frequently normally distributed
LoadRunner Report Template
Posted by on March 25, 2011
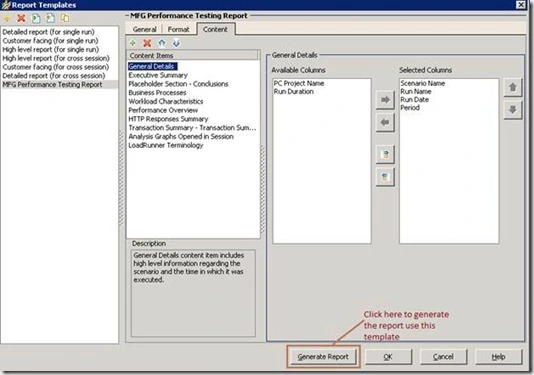
By using this template you can easily generate a customer facing report that includes a wide range of performance statistics. This template will automatically include any open graph you have in your analysis session as well as some other defined content items.
Go to Report—> Report templates. Six report templates have already been there , new reports can be created by duplicating them.
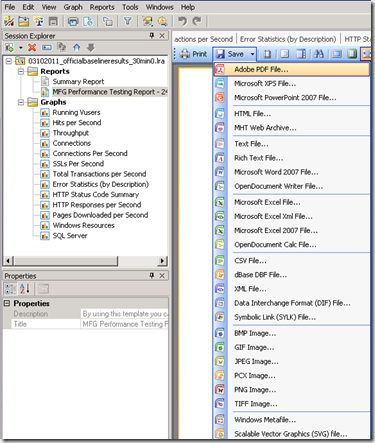
Then click OK to save the template. Also by clicking the Generate Report button, new report will be generated automatically, and it can be saved to different types.
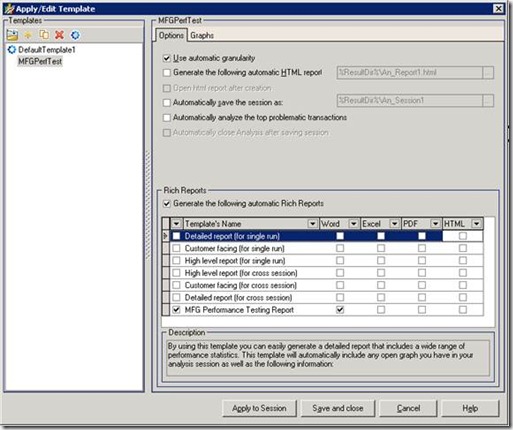
To make the template apply to the analysis session and get the graphs we need automatically , default template has to be defined. Go to Tools—>Templates, from here default template can be defined, and also the Rich Reports defined in the above steps can be selected and added to the analysis session.
When creating new template, the Graphs tab will contain the open graphs automatically, which makes the creating process really easy.
Positive and Negative Correlation
Posted by on March 25, 2011
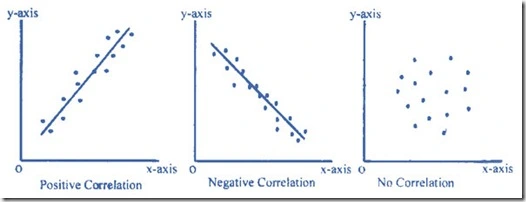
Positive Correlation:
The correlation in the same direction is called positive correlation. If one variable increase other is also increase and one variable decrease other is also decrease. For example, the length of an iron bar will increase as the temperature increases.
Negative Correlation:
The correlation in opposite direction is called negative correlation, if one variable is increase other is decrease and vice versa, for example, the volume of gas will decrease as the pressure increase or the demand of a particular commodity is increase as price of such commodity is decrease.
No Correlation or Zero Correlation:
If there is no relationship between the two variables such that the value of one variable change and the other variable remain constant is called no or zero correlation.
Strength
Correlations, whether positive or negative, range in their strength from weak to strong.
Positive correlations will be reported as a number between 0 and 1. A score of 0 means that there is no correlation (the weakest measure). A score of 1 is a perfect positive correlation, which does not really happen in the “real world.” As the correlation score gets closer to 1, it is getting stronger. So, a correlation of .8 is stronger than .6; but .6 is stronger than .3.
Negative correlations will be reported as a number between 0 and -1. Again, a 0 means no correlation at all. A score of –1 is a perfect negative correlation, which does not really happen. As the correlation score gets close to -1, it is getting stronger. So, a correlation of -.7 is stronger than -.5; but -.5 is stronger than -.2.
Remember that the negative sign does not indicate anything about strength. It is a symbol to tell you that the correlation is negative in direction. When judging the strength of a correlation, just look at the number and ignore the sign.
Imagine reading four correlational studies with the following scores. You want to decide which study had the strongest results:
-.3 -.8 .4 .7
In this example, -.8 is the strongest correlation. The negative sign means that its direction is negative.
Note
The problem that most students have with the correlation method is remembering that correlation does not measure cause. Take a minute and chant to yourself: Correlation is not Causation! Correlation is not Causation! I always have my in-class students chant this, yet some still forget this very crucial principle.
We know that education and income are positively correlated. We do not know if one caused the other. It might be that having more education causes a person to earn a higher income. It might be that having a higher income allows a person to go to school more. It might also be some third variable.
A correlation tells us that the two variables are related, but we cannot say anything about whether one caused the other. This method does not allow us to come to any conclusions about cause and effect.
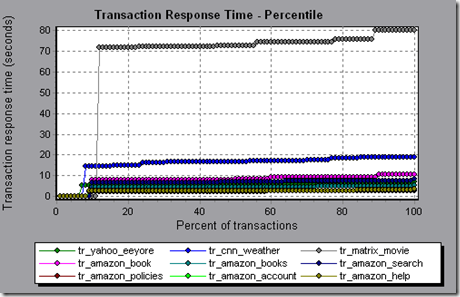
Transaction Response Time (Percentile) Graph
Posted by on March 23, 2011
This graph analyzes the percentage of transactions that were performed within a given time range.
Purpose
Helps you determine the percentage of transactions that met the performance criteria defined for your system. In many instances, you need to determine the percent of transactions with an acceptable response time. The maximum response time may be exceptionally long, but if most transactions have acceptable response times, the overall system is suitable for your needs.
X-axis
Percentage of the total number of transactions measured during the load test scenario run.
Y-axis
Maximum transaction response time (in seconds).
Note: Analysis approximates the transaction response time for each available percentage of transactions. The y-axis values, therefore, may not be exact.
Tips
Compare with Average Response Time Graph
It is recommended to compare the Percentile graph with a graph indicating average response time such as the Average Transaction Response Time graph. A high response time for several transactions may raise the overall average. However, if the transactions with a high response time occurred less than five percent of the time, that factor may be insignificant.
Example
In the following example, fewer than 20 percent of the tr_matrix_movie transactions had a response time less than 70 seconds:
Percentiles
Few people involved with developing software are familiar with percentiles. A percentile is a straightforward concept that is easier to demonstrate than define. For example, to find the 95th percentile value for a data set consisting of 100 page-response-time measurements, you would sort the measurements from largest to smallest and then count down six data points from the largest. The 6th data point value represents the 95th percentile of those measurements. For the purposes of response times, this statistic is read “95% percent of the simulated users experienced a response time of [the 6th-slowest value] or less for this test scenario.”
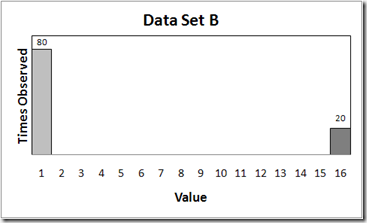
It is important to note that percentile statistics can only stand alone when used to represent data that is uniformly or normally distributed with an acceptable number of outliers . To illustrate this point, consider the exemplar data sets. The 95th percentile of Data Set B is 16 seconds. Obviously, this does not give the impression of achieving the 5-second response time goal. Interestingly, this can be misleading as well because the 80th percentile value of Data Set B is 1 second. With a response time goal of 5 seconds, it is likely unacceptable to have any response times of 16 seconds, so in this case neither of these percentile values represent the data in a manner that is useful to summarizing response time.
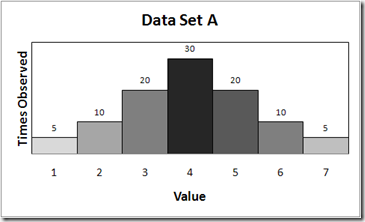
Data Set A is a normally distributed data set that has a 95th percentile value of 6 seconds, an 85th percentile value of 5 seconds, and a maximum value of 7 seconds. In this case, reporting either the 85th or 95th percentile values represents the data in a manner where the assumptions a stakeholder is likely to make about the data are likely to be appropriate to the data.
Comments: For Data Set A, 90 percent is 10 which means the 90% of the transactions have the response time no more than 10 seconds.
Quick&Dirty Loadrunner Ajax Debugging Tips
Posted by on September 29, 2010
http://siaconsulting.blogspot.com/2009/04/quick-dirty-loadrunner-ajax-debugging.html
Since I’ve been battling with AJAX and LoadRunner, I thought I’d compose a quick note about what I’ve found.
LR 9.5 AJAX Click & Script Protocol
If playback of Click & Script is failing, try right-clicking on the C&S code that is breaking, and select “Use alternative navigation” option. It will comment-out the existing code and try HTML level code in its place.
This has been very helpful – in many cases it saves you from having to re-record the BP in HTML mode. I have had some cases where it just comments-out the GUI code and provides nothing in its place. I have also found, maybe a coincidence (not enough solid evidence that this is a 1:1 relationship), that URL mode functions work best when this happens.
Also, when Playback fails:
Action.c(194): web_button(“INPUT_4”) highest severity level was “warning”, 55 body bytes, 252 header bytes [MsgId: MMSG-26388]
Action.c(204): web_browser(“Sync”) was successful [MsgId: MMSG-26392]
Action.c(211): web_browser(“FireContinueButton1”) was successful [MsgId: MMSG-26392]
Action.c(216): web_browser(“Sync”) was successful [MsgId: MMSG-26392]
Action.c(223): Downloading URL “https://app.url/OBG/Payment/PaymentInstruction.aspx” for an ActiveX object (asynchronous POST request) [MsgId: MMSG-26000]
Action.c(223): Warning -26276: JavaScript error (id=1) in line 5: ReferenceError: A is not defined [MsgId: MWAR-26276]
Action.c(223): Warning -26276: JavaScript error (id=0) in line 1: JavaScript evaluation error when executing function (by pointer) [MsgId: MWAR-26276]
Action.c(223): Warning -26000: ActiveX callback function failed. See previous message(s) [MsgId: MWAR-26000]
Action.c(223): web_button(“INPUT_4”) highest severity level was “warning”, 55 body bytes, 252 header bytes [MsgId: MMSG-26388]
Action.c(238): Think time – Waiting 2.00 seconds (according to limit).
This seems to be a LR failure. In the example above, it is failing on pretty common Microsoft ASP .NET code. In this particular case it was a form that had validations going on,
and some state that was not being correctly handled during playback. At this time I have found no relief from HP for this issue and had to use URL mode recording snippets to get around the offending forms.
I have found a similar behavior in two places for the app I am working on. Curiously, if playback the script in LR9.1 it gets past one of them. Ugh! Seems to be a JavaScript handler issue in both cases, just maybe works a tiny bit better in 9.1.
Debugging JavaScript in IE:
I found these links to be useful…
http://www.jonathanboutelle.com/mt/archives/2006/01/howto_debug_jav.html
http://www.codestore.net/store.nsf/unid/DOMT-5UBUVW?OpenDocument
You need some components from MS Office for this to work, but this standard MS IE debugger is just okay. It doesn’t seem possible to watch values (haven’t figured it out anyway), but you can at least step through the JavaScript.
Try to figure out what is happening in the browser manually that is not happening when LoadRunner is playing the script back.
As mentioned above, LR playback failure may be related to a state or trigger that is not being setup or fired correctly. If you can identify this missing link, you can likely manipulate/call it from your script to work around the issue.
Calling a JavaScript trigger is easy if you can dig the code out of the browser:
web_browser(“FireContinueButton1”,
ACTION,
“EvalJavaScript=WebForm_DoPostBackWithOptions(new WebForm_PostBackOptions(\”ctl00$MasterPagePlaceholder$btnContinue\”, \”\”, true, \”\”, \”\”, false, true))”,
LAST);
Just make sure that you follow all the standard embedded quote escape rules.
That’s all I know at this time. Good luck.
Foreign Loadrunner Materials
Posted by on September 28, 2010
Foreign Loadrunner Materials
We all know that LR is a difficult tool to master – a common refrain is that there is not enough material out there. nothing can be farther from the truth. I have compiled the following to help people willing to learn more on LR to find everything in one place
———————————————————————-
First start with your documentation on your PC.
Copy paste the file locations in your browser
Read First
What is Load Testing (10 Pages)
C:\Program Files\HP\LoadRunner\help\Learn_More_Testing.pdf
HP LoadRunner Quick Start (30 Pages)
C:\Program Files\HP\LoadRunner\tutorial\LR_QuickStart.pdf
Tutorial (150 Pages)
C:\Program Files\HP\LoadRunner\tutorial\Tutorial.pdf
User Guides
Virtual User Generator (1420 Pages)
C:\Program Files\HP\LoadRunner\help\vugen.pdf
Controller (552 Pages)
C:\Program Files\HP\LoadRunner\help\Cntrl_pc.pdf
Analysis (676 Pages)
C:\Program Files\HP\LoadRunner\help\analysis.pdf
Online Monitoring Reference (402 Pages)
C:\Program Files\HP\LoadRunner\help\online.pdf
Additional Reading
Installation Guide (80 Pages)
C:\Program Files\HP\LoadRunner\help\install.pdf
Monitoring Best Practices (248 Pages)
C:\Program Files\HP\LoadRunner\help\Monitoring_BP.pdf
Flex Protocol Enhancements (12 Pages)
C:\Program Files\HP\LoadRunner\dat\Flex.pdf
Thats 3580 Pages of information on LR – How many pages have you gone through? (I probably did less than 1500)
The above can also be found in Compiled Help Files. A couple like the Automation and Function reference are not found in the PDFs above, so it makes sense to list out the locations of these.
CHM Files
Everything from the above PDF listing
C:\Program Files\HP\LoadRunner\bin\online.chm
Function Reference
C:\Program Files\HP\LoadRunner\bin\FuncRef.chm
C Language function ref
C:\Program Files\HP\LoadRunner\bin\c_language_FuncRef.chm
Automation Reference (dont even go there)
C:\Program Files\HP\LoadRunner\bin\automation.chm
Well thats with the Documentation on your PC.
————————————————————-
Now for the online stuff. Remember, many of your queries can be solved by using the search functionality at any of the following sites. Make it a habit to devote time every week to go through the latest posts, and it will make quite a good difference in your learning path.
Email Lists:
http://tech.groups.yahoo.com/group/loadrunner/
http://groups.google.com/group/LR-LoadRunner
http://tech.groups.yahoo.com/group/Advanced-LoadRunner/ (very little activity there – only for experienced users)
Discussion Boards:
http://www.sqaforums.com/postlist.php?Cat=0&Board=UBB6 (ofcourse!)
http://forums13.itrc.hp.com/service/forums/categoryhome.do?categoryId=915 (HP Perf Center Forum)
http://www.bish.co.uk/forum/index.php?board=2.0 (Richard Bishop)
White Papers / Presentations:
HP LoadRunner tips and tricks
https://h10078.www1.hp.com/bto/download/loadrunner-configuration.pdf
Performance Center New Features:
http://hpbroadband.com/(S(vlbj3h3h2ej4qane0gsonc55))/program.aspx?key=5831MtEPC7May2009
LR Compiler
http://www.loadtester.com/under-hood-loadrunner-compiler
Blogs:
Official HP Blog: http://www.communities.hp.com/online/blogs/loadrunner/default.aspx
Scott Moore, Tim Chase et al http://www.loadtester.com/blog
Alexander Podelko http://www.testingreflections.com/blog/67
Stuart Moncrieff http://www.myloadtest.com/ & http://www.jds.net.au/tag/loadrunner/
Dmitry Motevich http://motevich.blogspot.com/ (includes video tutorials)
papayamilkshake/Hwee Seong Tan http://www.loadrunnertnt.com/tag/loadrunner/
Kim Sandell http://ptfrontline.wordpress.com/category/loadrunner/
Richard Bishop http://www.bish.co.uk/index.php?option=com_content&view=category&id=34:recent&Itemid=1
Wilson Mar: (deserves a seperate heading of his own – not a blog – but additional reading)
LoadRunner Architecture http://www.wilsonmar.com/1loadrun.htm
VUScripting http://www.wilsonmar.com/1lrscript.htm
VTS http://www.wilsonmar.com/1mercvts.htm
AJAX RIA web app load testing using LoadRunner http://www.wilsonmar.com/ajax_rec.htm
Results Explorer http://www.wilsonmar.com/lrexplore.htm
Twitter Feeds
Coming Soon
Protocol & Application Specific Resources
AJAX c & s
http://www.wilsonmar.com/ajax_rec.htm
Flex, AMF
http://hpbroadband.com/(S(3uelw04503pkjo55saxzlofd))/program.aspx?key=5831LoadRunner24March10
CITRIX
CITRIX document (for LR7.51)
http://www.ccaheaven.com/wps/Mercury%20Interactive’s%20LoadRunner%20for%20Citrix.pdf
Tim Chase CITRIX Scripting Best Practices
http://www.loadtester.com/whitepapers/Citrix_LoadRunner.pdf
Scott Moore’s CITRIX Scripting Tips
http://www.loadtester.com/citrix-tips-2007-part-1
Remedy ARS
From JDS http://www.jds.net.au/tech-tips/vugen-scripting-for-remedy/
Misc stuff
LoadRunner VuGen to JMeter conversion
http://www.performanceengineer.com/blog/lr2jm-convert-loadrunner-scripts-to-jmeter/
Various Links : http://loadtester.tumblr.com/
Certification Information:
http://h20546.www2.hp.com/main/americas/certification/?sitepick=PT (General Info)
http://www.hp.com/partnerlearning/learner_id.html (HP Learner ID)
https://ibt1.prometric.com/index.asp?ibt=9710657000& (Prometric Id)
Hello world!
Posted by on July 14, 2010
Welcome to WordPress.com. This is your first post. Edit or delete it and start blogging!
SQL Server – Performance Counter Guidance
Posted by on September 3, 2009
SQL Server – Performance Counter Guidance
|
Traditionally we have shied away from noting specific values or thresholds that are indicative of good or bad performance. One reason for this is because coming up with good values is quite hard to do, and people sometimes see that a particular value is outside of some threshold and become fixated on that being the issue when in reality it may not be. For example, the Windows NT Resource Kit had a section that stated that a disk queue length greater than two to three times the number of disk spindles was indicative of a performance problem. When working with SQL Server this is not always true, especially if read ahead activity is driving the disk queue length. Just because there is a queue waiting for IO does not necessarily mean that SQL Server is stalled waiting for the IO to complete. We have seen disk queue lengths up in the 20-30 range (on much fewer than 10 disks) where SQL Server performance was just fine. |
|
|
|
However, in the absence of specific values people sometimes look at Performance Monitor data and fail to spot interesting trends. So despite the hesitation to provide any specific values, we will attempt to note some thresholds where a given counter starts to attract the interest of those who have been working some of these cases over the past several years. Hopefully this will provide you some guidance in things that stand out. But ultimately, you will need to look for other counters that also seem out of range so that you can start developing a pattern of indicators that point to a particular type of problem. |
|
|
|
It should be fairly easy for you to visually identify a counter whose value changed substantially during a problematic time period. Quite often you will find that there are many counters that changed significantly. With a blocking problem, for example, you might see user connections, lock waits and lock wait time all increase while batch requests/sec decreases. If you focused solely on a particular counter (or a few counters) you might come to some very different conclusions about what the problem is, and you could very likely be wrong. Some of the changes in counter values are the cause of the original problem, whereas others are just side affects from that problem. |
|
|
|
In the ideal situation, the change in the counters that indicate the cause of the problem should lead the counters showing the affect, but due to the granularity used to capture Performance Monitor data some of these distinctions can be lost. If you collect data once every 15 seconds and the problem was of quick onset, it can be hard to figure out if user connections went up first and then lock timeouts, or vice versa. This is where you have to use other available information, such as other performance counters, the customer’s description of the problem, etc, to form a theory as to what you think may be wrong and then look for other supporting data to prove or disprove your theory. |
|
|
|
|
|
The most important counters are in blue. |
|
It is recommended to save the counters to a CSV file or a SQL Server database. |
|
The sample rate should be every 15 seconds. |
|
|
|
This is the list of the SQL Server counters only. Please also use the Windows Server Performance Counters. |




Recent Comments